Querying Raster Layers with Raster Attribute Tables
Introduction
In a previous post we looked at querying continuous rasters with TuiView. In this post we look at querying thematic rasters in TuiView. TuiView treats any raster with an attribute table as thematic.
Outputs from pyshepseg generally contain raster attribute tables. See our previous post on performing a segmentation and gathering statistics that are put into the raster attribute table.
KEA and HFA are the only GDAL drivers that currently properly support raster attribute tables (RAT) natively. For some drivers (like GeoTiff), GDAL saves the RATs in a sidecar .xml file. This can be very inefficient and slow for large RATs so we recommend using KEA or HFA where possible. Some drivers (again, like GeoTiff) support a similar idea, but just for colors, called “Colour Tables”.
Raster attribute tables can have colour columns. If the RAT has colour tables, or there is a Colour Table present, you can ask that TuiView open the file as “Color Table” and you will see the behaviour described in this post. This is the default behaviour of TuiView but can be overridden in the the stretch dialog, or in the default stretch.
Querying Thematic Rasters
If you open a file that has a Raster Attribute Table with colours, you will
see something like the following when you press the Query Button ( ):
):
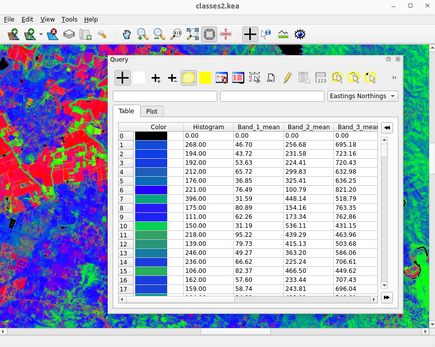
Note that the image is displayed using the colours in the colour table. Also, note how that the color columns in the RAT are also shown as a single “Color” column with the actual colour shown as a rectangle. The other columns of the RAT are shown with their values. The rows are also numbered on the left and the table can be scrolled up and down.
Only the currently shown part of the table is loaded into memory. This means that TuiView can handle enormous RATs without running out of memory.
Highlighting a row in the table and highlighting areas of the raster by selecting rows
If you click on the raster with the Query Tool, the corresponding row will
be highlighted in yellow and the table will be scrolled to
show that row.
If you click on a row it is selected. TuiView makes a distinction between
highlighted and selected rows. Selected rows are shown in blue in the
table. You can select more than one row by holding down the Ctrl key before
clicking another row - the first one will stay selected. You can add as
many rows as you like to the selection using this method. If you want to select
a range of rows, click the first row of the range then while holding the Shift
key, click the last row. The rows you clicked on will be selected along
with the rows between.
By default, the areas on the map that correspond to the selected row(s) will
be highlighted in yellow. You can prevent the map being highlighted using the
Highlight Selection button  on the toolbar. Next to this button is a yellow button that allows you to change
the selection colour. Clicking this brings up a colour chooser and when
you select a colour, selected rows are shown as this colour on the map and the
colour of this button on the toolbar is updated.
There are also buttons to remove all selected rows (
on the toolbar. Next to this button is a yellow button that allows you to change
the selection colour. Clicking this brings up a colour chooser and when
you select a colour, selected rows are shown as this colour on the map and the
colour of this button on the toolbar is updated.
There are also buttons to remove all selected rows ( )
and select all rows (
)
and select all rows ( ).
).
This “Faster Forward” and “Rewind” Buttons can be used to scroll up or down to the next selected row(s) in the table.
Changing how the table is displayed
By default, the columns appear in the order they were written to the file
(with the exception that the colour column appears first). If you wish to change
the order in which the columns appear, right click on a column header and select
“Move Left”, Move Right”, “Move Left Most” or “Move Right Most”. The column
will then move as directed. You can save the column order so TuiView uses
this next time you open the file by selecting the Save Column Order Button
( )
but the file must be in update mode - more detail on update mode is
provided below.
If you right click on a floating point column, an option called “Set
number of decimal places” appears. Use this to change the number of
decimal places from the default (2).
)
but the file must be in update mode - more detail on update mode is
provided below.
If you right click on a floating point column, an option called “Set
number of decimal places” appears. Use this to change the number of
decimal places from the default (2).
Geographical Selection
You can also select rows by selecting areas on the map. There are
3 ways to do this: by polygon, by line and by point.
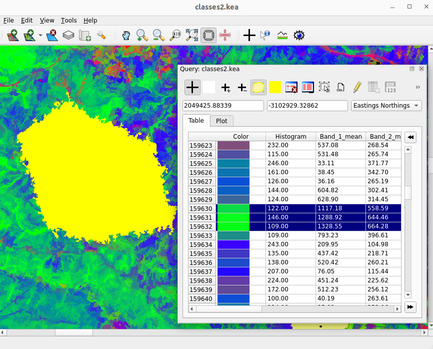
To select rows by polygon, select the Geographic Selection by Polygon Tool
( ).
Then on the map, left click the first vertex of the polygon, then the next and the next.
When you have finished, right click and the polygon will be closed. The rows
that intersect with this polygon will be highlighted on the map and selected
in the table:
).
Then on the map, left click the first vertex of the polygon, then the next and the next.
When you have finished, right click and the polygon will be closed. The rows
that intersect with this polygon will be highlighted on the map and selected
in the table:
You can also select rows that sit along a line using the Geographic Select
by Line Tool ( ).
This operates similiarly to the Profile Tool. Left click on the start of the line, and
any vertices. Right click to end the line. Rows that intersect the line will
be highlighted on the map and selected in the table.
).
This operates similiarly to the Profile Tool. Left click on the start of the line, and
any vertices. Right click to end the line. Rows that intersect the line will
be highlighted on the map and selected in the table.
Lastly, you can select points using the Geographic Select by Point Tool
( ).
Simply click a point on the map and the row for that point will be selected.
).
Simply click a point on the map and the row for that point will be selected.
Note that with all these tools, holding the Ctrl key down will add the new rows to the current selection instead of unselecting any rows first.
Select by expression
There is another way of selecting rows in the RAT - with an expression.
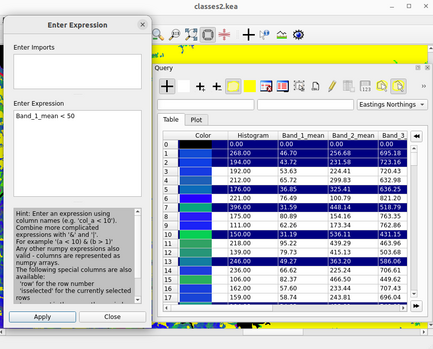
To select by expression, select the Select using an Expression button
( ).
A window is opened that allows you to enter an expression (plus any imports your expression may require).
Each column appears as a Python variable (actually a numpy array). There are some tricks about combining
expressions and “extra” columns provided in the help text. Entering an expression that returns a boolean
and pressing “Apply”
selects the matching rows in the table (and highlights on the map):
).
A window is opened that allows you to enter an expression (plus any imports your expression may require).
Each column appears as a Python variable (actually a numpy array). There are some tricks about combining
expressions and “extra” columns provided in the help text. Entering an expression that returns a boolean
and pressing “Apply”
selects the matching rows in the table (and highlights on the map):
Note this window stays open until you select “Close” so you can easily modify your expression.
Also, be aware that your expression is evaluated multiple times, once for each “block”
of the RAT (in a manner similar to rios.ratapplier) so you will need to ensure that anything
returned matches the shape of the input(s) to your expression. For example, to select
random rows, you may do something like this:
numpy.random.rand(*row.shape) < 0.5
This uses the shape of the row array to create a boolean array of the correct shape.
Saving selected rows as a .csv
Once you have selected rows, either manually, by geographic select or by expression
(or a mix of all 3) you can save the selected rows by using the Export Selected Rows
to CSV button on the toolbar ( ).
You are prompted for the name of the file to save.
This means the data from the selected rows can be imported into a spreadsheet, a database or
some other custom Python script for further processing.
).
You are prompted for the name of the file to save.
This means the data from the selected rows can be imported into a spreadsheet, a database or
some other custom Python script for further processing.
Updating the RAT
The last main feature that TuiView has when viewing a thematic raster file is the ability
to update the file. To do this you need to put the file into “Update” mode. This is done
by using the Toggle updates to dataset button on the toolbar ( ).
While the file is open in update mode, this button stays down. To flush all changes to the
file, press this button again and the file will go back to being open in read only mode.
).
While the file is open in update mode, this button stays down. To flush all changes to the
file, press this button again and the file will go back to being open in read only mode.
Once the file is open in update mode, the following features become available:
- The column order can be saved to the file (changing the column order is discussed above)
by using the Save Column Order button () on the toolbar.
Note that the new order is only visible by TuiView and it won’t change what is seen
in other software.
- New columns can be created using the Add Column button (
 ) on the toolbar.
You will be prompted for the type and name of the column
) on the toolbar.
You will be prompted for the type and name of the column - You can edit selected rows of a column using an expression.
- You can updated selected rows of a column with a value entered on the keyboard.
These last two features are discussed below.
To update selected rows of a column, right click on the column you wish to modify. Select “Edit Selected Rows in Column” option. You will then be presented with a similar window to the “Select by Expression” case, but here your expression needs to yield a value to put in the array. This can be done by using other columns (again available as numpy arrays) or a scalar:
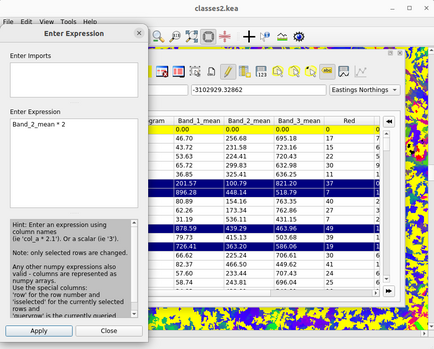
Pressing “Apply” will update the column for selected rows. Note that like selecting rows by expression, the expression entered here will be applied to the RAT in blocks.
For quickly updating selected rows in a column, there is another option for setting values from the keyboard. To use this, right click on the column you wish to update and select the “Set column to receive keyboard edits” option in the menu. Select the rows you wish to update, enter the values with the keyboard and press enter. The selected rows will then be updated. To get out of this mode, right click on the column and select “Set column to receive keyboard edits” again which should uncheck the tickbox next to this option. This option is designed for quick classification of segments. The idea is that you select your row(s) with a geographic selection and quickly update these to a value that you enter with the keyboard, and then move onto the next segment(s). The resulting column can be used to train a model.
It is worth noting that you can edit the colours by either updating the individual colour columns or right clicking on the “Color” column and selecting “Set Color of Selcted Rows”. This will bring up a colour chooser where you can choose a colour and the colour columns will be updated.
Conclusion
TuiView has some sophisticated tools for querying and updating thematic rasters. These features go beyond what most packages provide and make working with Raster Attribute Tables a powerful tool.