Querying Continuous Raster Layers and Vectors with TuiView
Introduction
The basic operation of TuiView has been covered in a previous post. This post demonstrates the querying functionality of TuiView on continuous rasters and vector files. Querying thematic rasters will be the subject of a future post.
The Query Dock Window
Once you have loaded file(s) in to your viewer, press the Query Window button (  ) and the Query Dock Window will be displayed. Clicking a point within the
raster will populate the values:
) and the Query Dock Window will be displayed. Clicking a point within the
raster will populate the values:
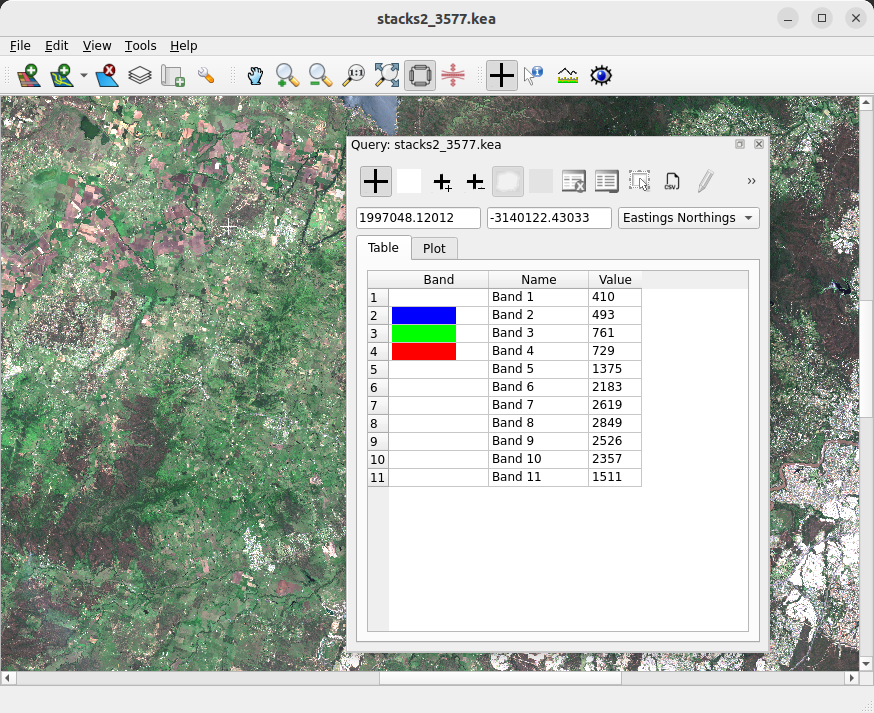
The pixel values for the point are shown in the table. Bands currently displayed will have colour next to them in the table representing the colour that they are shown as in the stretch. The “Name” column contains the names that the bands have been given in GDAL.
Clicking a new point within the raster will update the values for the new point.
Note that a crosshair will be displayed on your raster where you have clicked. There are
buttons on the Query Window toolbar for turning off the update of the Query Window with a new
point (), changing the colour (a white button by default, but changes to match colour chosen) and size of the crosshair ( ,
,
 ).
).
Turning off the update of the Query Window allows you to query more than one area in the window. You can start a new Query Window by selecting “New Query Window” under the “Tools” menu, or pressing Ctrl+C. By default both windows update when a new point is selected. However, if this is turned off in one the values stay the same when they are updated in the other window allowing values from different areas to be shown at once.
You can double click the title bar of the Query Window to dock it onto the window it belongs to.
Plotting
You can also see the values as a line plot by clicking on the “Plot” tab of the Query Window:
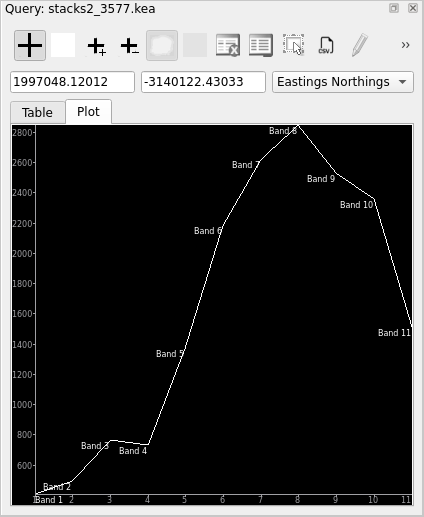
The label of each point will be the name of the bands given in GDAL. Clicking a new
point will update the plot. On the toolbar of the Query Window there are buttons for
turning off the plot labels ( ), saving the plot (
 )
and changing the scaling used in the plot
(
)
and changing the scaling used in the plot
( ).
).
Coordinates
The coordinates of the clicked point are shown between the toolbar and the table of values in the Query Window. By default, these coordinates are shown in the projection of the raster file. These can be changed to lat/long or raw raster coordinates (pixel/row) by using the combo box on the right. You can also update the coordinates by typing in new value. Pressing Enter while one of the coordinate boxes has focus will move the crosshair and update the values in the table.
Querying only displayed rasters
By default, if you have more than one raster layer loaded in a window, the values for the top raster layer are displayed whether that layer is presently switched on or off in the Layer Window. To change the behaviour so that the top displayed layer is shown, toggle the “Query Only Displayed Layers” option in the “File” menu.
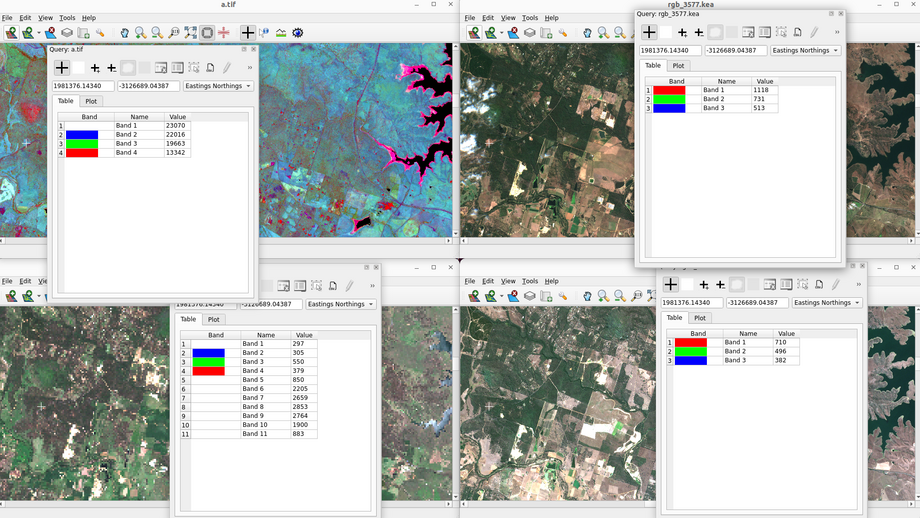
Geo linking
If you have more than one TuiView window with the Query Window open each of the Query Windows will be updated when you click in one of the windows. This is handy for seeing what is happening in the one spot in more than one image all at once:
Profile
To see how values vary spatially, open the Profile Window by clicking the Profile Button
( ).
).
Left click on the raster to start the profile line, then move to where you want the line to end and right click. The plot will then be updated to show the profile along your line. Note if you don’t want a straight line, you can left click at each point where the line needs to change direction:
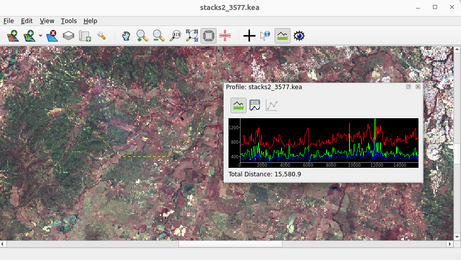
The bands that are displayed are the bands that are shown in the raster. The colours of these lines matches the colours the bands are shown as (red, green blue).
Note that like the Query Window, double clicking on the Profile Window will dock it into the window it belongs to.
On the toolbar of the Profile Window there are buttons for following the latest
profile line (),
saving the plot ()
and changing the scaling used in the plot
().
Like in the query window, not updating with a new line allows you to show profiles for different areas (you can create a second profile window by selecting “New Profile/Ruler Window” from the “Tools” menu or pressing Ctrl+S). One you’ve stopped updating the profile in one window, the other one will still be updated.
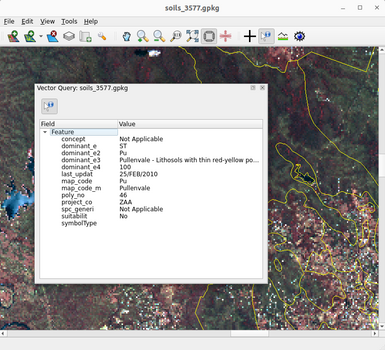
Querying Vectors
If you have loaded vectors into your window you can query them using the Vector Query Window.
This can be opened by clicking the  button. Once this window is open, clicking within a vector will show all the attributes of the vector
at that point:
button. Once this window is open, clicking within a vector will show all the attributes of the vector
at that point:
There is one tool on the toolbar - the button that controls following the query vector tool
().
As with the other tools, you can start another Vector Query Tool with the “New Vector Query Window”
from the “Tools” menu.
Note that like the Query Window and Profile Window, double clicking on the Vector Query Window will dock it into the window it belongs to.
Conclusion
The querying capabilities are a powerful feature of TuiView. Combined with Geo Linking, this gives you a good way to understand what is going on with your data. A future post will cover querying thematic data in TuiView which is a larger topic.