Introducing a TuiView Plugin for linking RatZarr files
Introduction
In a previous post we looked at the existing TuiView plugins. There is now a new plugin that allows you to link Raster Attribute Data in .zarr format created by the RatZarr package.
Installation
See the plugin installation instructions
for more detail. The recommended way of installing tuiview-plugins is from the git repo:
pip install git+https://github.com/ubarsc/tuiview-plugins.git
You will need to have TuiView installed in your current environment. You can
then run tuiviewpluginmgr on the command line. By enabling “RatZarr Query Window plugin”
you will see what your TUIVIEW_PLUGINS_PATH environment variable needs to be
set to.
Requirements
You must have an existing raster file with a Raster Attribute Table. Ideally this file will have colour columns as TuiView only displays colours that are part of a Raster Attribute Table within the file. This file needs to be loaded into TuiView.
Additionally you should have a .zarr file created by the RatZarr package. This .zarr file should have the same number of rows as the Raster Attribute Table in your raster file.
Workflow
Once the above requirements are met you should be ready to go. Once you
have the plugin loaded and a raster file with a Raster Attribute Table
in a viewer you can click on the Query Button ( ).
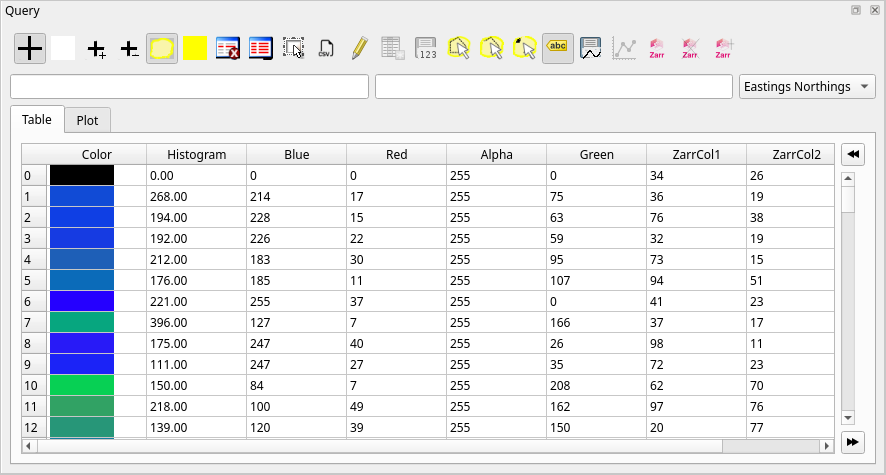
The Query Window is displayed as normal but there are 3 extra buttons:
).
The Query Window is displayed as normal but there are 3 extra buttons:
- Link a RatZarr file (
 )
) - Unlink the RatZarr file (
 )
) - Add a Column to the currently linked RatZarr file (
 )
)
Note that you may need to click the 2 arrows to see all the buttons on the toolbar if your window is small.
When you attempt to link a RatZarr file you will be asked to provide the path:
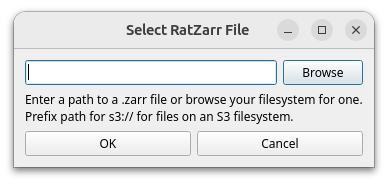
Note this can be a s3:// style path for a file on S3, although you will need
to have logged into AWS.
Once you have successfully linked, the extra RatZarr columns will appear after the columns in the Raster Attribute Table:
Supported Operations
Most of the existing functionality with the Query Window should work with columns from a RatZarr file.
Columns with width set to greater than one will show the individual elements
separated by a vertical bar (|).
You can use the RatZarr columns to select rows in the table by expression. The RatZarr
columns can be used in the expression window just the same as columns in the RAT. If
you expression contains columns with width>1, you can access individual parts of the
sub array with the zarrcol[..., 0] syntax to access the first subcolumn for example.
It is possible to add a column to either the RAT or RatZarr. Adding columns to the RAT is using
the same Add Column button ( ) on the toolbar.
Adding columns to the RatZarr file is done through the “Add Column to RatZarr button” ().
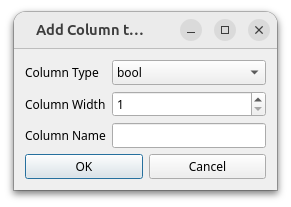
When you click this button, you will be presented with a dialog asking you about the data
type (allowing you to choose any of the supported Zarr column types), width and name:
) on the toolbar.
Adding columns to the RatZarr file is done through the “Add Column to RatZarr button” ().
When you click this button, you will be presented with a dialog asking you about the data
type (allowing you to choose any of the supported Zarr column types), width and name:
Also, you can move the order of the columns so they are intermixed with the columns from the raster file. Saving the column order saves to the raster file. TuiView ignores columns that are not in the raster’s list of column orders when it loads a file. When a RatZarr file is loaded with those columns, it will then apply the previously saved order.
You can update a RatZarr column by going into edit mode ( )
and right clicking on a RatZarr column header and selecting “Edit Selected Rows in Column” - the
same as RAT columns. Other RatZarr columns will appear as
variables just the same as in the expression window.
)
and right clicking on a RatZarr column header and selecting “Edit Selected Rows in Column” - the
same as RAT columns. Other RatZarr columns will appear as
variables just the same as in the expression window.
A RatZarr column can be set to receive to receive keyboard edits, but only for columns where width=1.
You can export a CSV and this will include all RatZarr columns.
A RatZarr column can also be used as a column table lookup into a surrogate colour table for columns where width=1.
Conclusion
Linking a RAT from a raster file with a RatZarr file is a handy way to leverage the benefits of both formats. It also makes it possible to save different types of statistics in separate RatZarr files and only open the necessary ones for each task making the management of the columns easier.